Friday, February 25, 2011

Silverlight 4

Things I got from watching the videos in TekPub on Silverlight

Nice things from the Video:

<ItemsControl ItemsSource="{Binding}"

does a data binding to the current DataContext, ItemsControl is a list of items


<ItemsControl.ItemTemplate>

specify how the items are going to be shown, binding here will be to the inside items


Margin

Attribute for how far from the outside is the element


Padding

Attribute for how is the distance from the context inside of it to the edge


Binding has a StringFormating good for date fields


<UserControl … d:DataContext="{d:DesignInstance Type=local:DemoClass, IsDesignTimeCreatable=True}"

Does a databinding in design time to see how the control will look like


Markup Extension has a default property, binding has Path:

{Binding Path=Hello} is the same as {Binding Hello}


Attached Properties, for example in grid: (ClassName.Property)

<Button Grid.Column=1


x:Name or Name are interchangeable when there is a Name property (one sets the other). You should use the x:Name because it always exists.


Panels

Canvas specify the exact location of the controls from the top and the left, by Canvas.Top and Canvas.Left. CAnvas.ZIndex sets which control is top/bottom, a higher value renders on top. Control can be set outside of the canvas.


Grid

Height = * (Weighted proportion can be 2* or 2.5*) / 50 (fixed value) / Auto (collapse to the smallest possible height)

the default is *

HorizontalAlignment: Left, Center, Right, Stretch. Center is the same as Stretch when the width is set

VerticalAlignment: Top, Center, Bottom, Stretch. Center is the same as Stretch when the heightis set


StackPanel no attached propertiies

Orientation – Vertical (default), Horizontal


Silverlight Toolkit: Silverlight.codeplex.com

DockPanel

toolkit:DockpanelDock=”Top” will cause the control to dock to the top


WrapPanel like the StackPanel but wraps the controls to the next row/column


Controls

Controls and Dialog Boxes – MSDN page that lists almost all the official controls

Sources: Runtime, SDK, Toolkit


Border Control (Runtime without a namespace) – adds a border with color, margin, padding.

Has only one child element.


ScrollViewer add a scroll to content when needed. The horizontal is by default disabled.


ViewBox the default stretches the child elements.

StretchDirection: UpOnly (larger only), DownOnly (small only), both


GridSplitter (SDK) dynamically change the size of the grid column/rows

Grid.Column tells it which columns to effect is

It overlaps the controls, so you should add a column for the splitter and add HorizontolAlligment=”Center”


ChildWindow show a model popup

need to add Silverlight Child Window control

Has a Show method to show the child window


Open/save file

var a = new OpenFileDialog();

a.MultiSelect

a.Filter = “(*.cad)|*.cad;*.cdw|(images) ;*.bmp”;

a.ShowDialog(); returns true/false

var result = a.File;

a.Files (when Multiselect = true)

var b = SaveFileDialog();

b.ShowDialog();


Databinding:

Silverlight-databinding

(not mine taken from the presentation)


Change Notifications:

INotifyPropertyChanged – notify the UI that a property was changed

Passing an empty string gives a notification that everything was changed


Value Convertor:

bool to visibility

IValueConvertor

Convert has a parameter


Mode:

OneTime (take first binding), OneWay (default readonly), TwoWay (changes is from the control and source)


Binding to other controls:

{Binding ElementName=ControlName, Path=PropertyName}


Building Business Applications

WCF RIA Services, Project Building Business Applications

Asset – Graphic styles, resources

Models – domain models

Views – screens in SL

GlobalSuppressions.cs – turn off some of the code analysis that is on by default


Web - Models\Shared code compile on both projects (In it is under Genereated_Code hidden folder)


Add EntityFramework of the DB in the Web Project – name myEf

Add Domain Service class to the Web Project


<ds:DomainDataSource x:Name="blahData" QueryName="BlahQuery">

   <ds:DomainDataSource.DomainContext>

       <my: MyEfDomainContext />


<sdk:DataGrid ItemSource="{Binding Data, ElementName=blahData}"


<sdK:DataPager Source="{Binding Data, ElementName=blahData}" PageSize="30"/>

The data in the service needs to be ordered before doing this


Building Business Applications, part 2

DataFormControl

Navigation Framework -

<navigation:Frame>

    <navigation:Frame.UriMapper>

        <uriMapper:UriMapper>

             <uriMapper:UriMapping Uri="" MappedUri="/Views/Home.xaml"/> <—Default page

             <uriMapper:UriMapping Uri="/{pageName}" MappedUri="/Views/{pageName}.xaml"/> <—Default page

        </uriMapper:UriMapper>

    </navigation:Frame.UriMapper>

</navigation:Frame>

<LinkButton NavigateUri="/Customer" …/>

Navigates to /Views/Customer.xaml page


Ctrl+K, Ctrl+D To reformat the XAML


Using the CustomDataForm (created by the project template)

<c:CustomDataForm AutoGenerateFields="True" ItemsSource="{Binding Data, ElementName=blahData}"

EditEnded="Event_a" CommandButtonsVisibility="All"/>

Should be used with Pager, show by default read only fields, must fields

Event_a(…){

if(e.EditAction == DataFormEditAction.Commit ){

if(!CustomerData.IsSubmittingChanges) CustomerData.SubmitChanges();

}}


Data Annotations in Web:

XDomainService.metadata.cs

Possible Attributes:

[Required(ErrorMessage="you…")]

[StringLength]

[RegularExpression]

[Range]

[EnumDataType] – must be a value in the enum

[CustomValidation]

[Display] – the text of the field

[Editable] – readonly


Setting up the wanted fields:

<c:CustomDataForm AutoGenerateFields="True" ItemsSource="{Binding Data, ElementName=blahData}" >

<c:CustomDataForm.EditTemplate>

<DataTemplate>

<StackPanel>

<TextBox Text="{Binding Company, Mode=TwoWay}"/>

</StackPanel>

</DataTemplate>

</c:CustomDataForm.EditTemplate>

</c:CustomDataForm>


Add/Delete is built in

Delete doesn’t commit out of the box, the pattern seen is an extra button to submit all the changes


BusyIndicator – when busy any control inside the control are readonly and a busy pop up is being shown

Wrap all the controls in a BusyIndicator, one of the controls the template creates

<c:BusyIndicator BusyContent="Loading…" IsBusy="{Binding IsLoadingData, ElementName=InvoiceData}">

Sunday, February 20, 2011

Rebuild All failed without any errors (Silverlight), Part 2

A bit of an update from part 1.

I decided to do a clean of the solution (plus manually delete the XAP from the web project) and then a build and got this in the build:

MSBUILD : error : Xap packaging failed. Exception of type 'System.OutOfMemoryException' was thrown.

So the first thing I decided to do was open a new Visual Studio 2010 and attach it to the old instance of VS2010. Then clean –> rebuild This time I got a bit more:

'devenv.exe' (Managed (v4.0.30319)): Loaded 'C:\Program Files\Microsoft SDKs\Expression\Blend\Silverlight\v4.0\Libraries\System.Windows.Interactivity.dll'
'devenv.exe' (Managed (v4.0.30319)): Loaded 'c:\Program Files\Reference Assemblies\Microsoft\Framework\Silverlight\v4.0\System.Xml.dll'
'devenv.exe' (Managed (v4.0.30319)): Loaded 'C:\Program Files\MSBuild\Microsoft\Silverlight\v4.0\XamlServices.dll'
A first chance exception of type 'MS.Internal.Xaml.XamlTypeResolutionException' occurred in XamlServices.dll

… Just imagine 600 more lines like those 2

A first chance exception of type 'MS.Internal.Xaml.XamlTypeResolutionException' occurred in XamlServices.dll
A first chance exception of type 'System.OutOfMemoryException' occurred in Microsoft.Silverlight.Build.Tasks.dll
A first chance exception of type 'System.ArgumentException' occurred in Microsoft.VisualStudio.ORDesigner.Dsl.dll
…Another repeat performance this time only 10 lines

A first chance exception of type 'System.ArgumentException' occurred in Microsoft.VisualStudio.ORDesigner.Dsl.dll
A first chance exception of type 'JetBrains.Util.Assertion.AssertionException' occurred in JetBrains.Platform.ReSharper.ProjectModel.dll
A first chance exception of type 'System.InvalidOperationException' occurred in JetBrains.Platform.ReSharper.VSIntegration.dll
A first chance exception of type 'System.InvalidOperationException' occurred in JetBrains.Platform.dotTrace.VSIntegration.dll

…Seems like dotTrace and Resharper are playing a tag war with Exceptions and my system resources…

At this point I decided to do two things:

  1. Uninstall dotTrace Performance since I don’t really use it
  2. Use dotTrace Memory profiler on Visual Studio 2010 and see where the hell all my memory is being wasted… unfortunately that failed me since dotTrace Memory needed more memory than I had.

The next thing I decided to do is uninstall Resharper 6.0 EAP and work without Resharper, well no problems for a day but also less work.

At this point I decided to try working with Resharper 5.1 and the problem returned it just took VS ~7 hours to fail my build. Looking at the clean output this time got me:

========== Clean: 20 succeeded, 10 failed, 0 skipped ==========

Looking at the debug output of the clean, I had this errors:

A first chance exception of type 'System.ArgumentException' occurred in Microsoft.VisualStudio.ORDesigner.Dsl.dll (188 times)
A first chance exception of type 'System.IO.DirectoryNotFoundException' occurred in mscorlib.dll  (2 times)
'devenv.exe' (Managed (v4.0.30319)): Loaded 'C:\Program Files\MSBuild\Microsoft\Silverlight\v4.0\XamlServices.dll' (4 times)
'devenv.exe' (Managed (v4.0.30319)): Loaded 'c:\Program Files\Reference Assemblies\Microsoft\Framework\Silverlight\v4.0\System.Windows.dll' (4 times)
A first chance exception of type 'MS.Internal.Xaml.XamlNamespaceException' occurred in XamlServices.dll (23 times)
A first chance exception of type 'System.IO.FileNotFoundException' occurred in mscorlib.dll (20 times)
A first chance exception of type 'MS.Internal.Xaml.XamlTypeResolutionException' occurred in XamlServices.dll (712 times)

A first chance exception of type 'JetBrains.Application.Progress.ProcessCancelledException' occurred in JetBrains.Platform.ReSharper.Shell.dll (2 times)
A first chance exception of type 'JetBrains.Metadata.Utils.PE.MetadataReaderException' occurred in JetBrains.Platform.ReSharper.Metadata.dll (4 times)
A first chance exception of type 'System.ArgumentException' occurred in JetBrains.Platform.ReSharper.Metadata.dll (7 times)
A first chance exception of type 'JetBrains.Application.Progress.ProcessCancelledException' occurred in JetBrains.ReSharper.Daemon.dll (5 times)
The thread 'Cache.AddAssembly #0' (0x2038) has exited with code 0 (0x0). (1 times)
The thread 'Cache.AddAssembly #1' (0x23f8) has exited with code 0 (0x0). (1 times)
A first chance exception of type 'Microsoft.Build.Shared.InternalErrorException' occurred in Microsoft.Build.dll (26 times)

'devenv.exe' (Managed (v4.0.30319)): Loaded '...' (41 times)

The thread '<No Name>' (0x####) has exited with code 0 (0x0). (16 times)

---Cleaned Failed Message---
A first chance exception of type 'JetBrains.ReSharper.Psi.Xaml.Parsing.MarkupExtensionsTreeBuilder.IsTextException' occurred in JetBrains.ReSharper.Psi.Xaml.dll (29 times)


I am pretty sure I have problems in my xaml but why and where? I believe the Xaml has troubles being parsed but it makes do with what it has (by throwing exceptions which the compiler ignores). I don’t understand why the application works though…

So while the debugger is still attached I tried opening a Xaml file, got my errors:

A first chance exception of type 'System.ArgumentException' occurred in mscorlib.dll (2 times)
A first chance exception of type 'System.BadImageFormatException' occurred in mscorlib.dll (9 times)
A first chance exception of type 'System.IO.FileNotFoundException' occurred in mscorlib.dll (1 times)
'devenv.exe' (Managed (v4.0.30319)): Loaded '...' (6 times)
A first chance exception of type 'System.ArgumentOutOfRangeException' occurred in mscorlib.dll (3 times)

It took me a while but I got the BadImageFormatException details:

Message: Could not load file or assembly 'System.Core.ni.dll' or one of its dependencies. An attempt was made to load a program with an incorrect format.

Stack Trace: at System.Reflection.AssemblyName.nGetFileInformation(String s)
     at System.Reflection.AssemblyName.GetAssemblyName(String assemblyFile)

Could not load file or assembly 'System.Net.ni.dll' or one of its dependencies. An attempt was made to load a program with an incorrect format.

And also for: 'System.ni.dll', 'System.Runtime.Serialization.ni.dll', 'System.ServiceModel.ni.dll', 'System.ServiceModel.Web.ni.dll', 'System.Windows.Browser.ni.dll', 'System.Windows.ni.dll', 'System.Xml.ni.dll'.

Thank God it didn’t search for Knight.ni.dll… (it seems I am not the first developer with this joke…)


The FileNotFoundException was caused by:

Message: Could not load file or assembly 'System.debug.resources, Version=2.0.5.0, Culture=en-US, PublicKeyToken=7cec85d7bea7798e' or one of its dependencies. The system cannot find the file specified.

FusionLog:

=== Pre-bind state information ===
LOG: User = (my user)
LOG: DisplayName = System.debug.resources, Version=2.0.5.0, Culture=en-US, PublicKeyToken=7cec85d7bea7798e
(Fully-specified)
LOG: Appbase = file:///c:/Program Files/Microsoft Visual Studio 10.0/Common7/IDE/
LOG: Initial PrivatePath = NULL
Calling assembly : (Unknown).
===
LOG: This bind starts in default load context.
LOG: Using application configuration file: c:\Program Files\Microsoft Visual Studio 10.0\Common7\IDE\devenv.exe.Config
LOG: Using host configuration file:
LOG: Using machine configuration file from C:\Windows\Microsoft.NET\Framework\v4.0.30319\config\machine.config.
LOG: Post-policy reference: System.debug.resources, Version=2.0.5.0, Culture=en-US, PublicKeyToken=7cec85d7bea7798e
...

Stack Trace:

at System.Reflection.RuntimeAssembly._nLoad(AssemblyName fileName, String codeBase, Evidence assemblySecurity, RuntimeAssembly locationHint, StackCrawlMark& stackMark, Boolean throwOnFileNotFound, Boolean forIntrospection, Boolean suppressSecurityChecks)
at System.Reflection.RuntimeAssembly.nLoad(AssemblyName fileName, String codeBase, Evidence assemblySecurity, RuntimeAssembly locationHint, StackCrawlMark& stackMark, Boolean throwOnFileNotFound, Boolean forIntrospection, Boolean suppressSecurityChecks)


And twice for:

Could not load file or assembly 'file:///C:\Projects\Company.GIS.GISApp\Bin\Company.GIS.GISApp.dll' or one of its dependencies. The system cannot find the file specified.

(this is my Web application that host the XAP file)


I decided going over my XAML files with the designer opened and fix the errors:

  1. Cannot register duplicate Name '…' in this scope. Fixed using this. The reason behind this can be found here.
  2. The file '/FolderName/ControlNameResources.xaml' is not part of the project or its 'Build Action' property is not set to 'Resource'. Fixed this by giving the correct path: '../FolderName/ControlNameResources.xaml'
  3. Cannot find a Resource with the Name/Key WebConfig [Line: 53 Position: 37]. Now this was in a control that was already fixed
  4. Element is already the child of another element. [Line: 0 Position: 0]. Again the same control as in 3,
  5. System.InvalidOperationException
    An unhandled exception was encountered while trying to render the current silverlight project on the design surface. To diagnose this failure, please try to run the project in a regular browser using the silverlight developer runtime.
       at Microsoft.Windows.Design.Platform.SilverlightViewProducer.OnUnhandledException(Object sender, ViewUnhandledExceptionEventArgs e)
       at Microsoft.Expression.Platform.Silverlight.SilverlightPlatformSpecificView.OnUnhandledException(Object sender, ViewUnhandledExceptionEventArgs args)
       at System.EventHandler`1.Invoke(Object sender, TEventArgs e)
       at Microsoft.Expression.Platform.Silverlight.Host.SilverlightImageHost.<>c__DisplayClass1.<Application_UnhandledException>b__0(Object o)
       at System.Windows.Threading.ExceptionWrapper.InternalRealCall(Delegate callback, Object args, Int32 numArgs)
       at MS.Internal.Threading.ExceptionFilterHelper.TryCatchWhen(Object source, Delegate method, Object args, Int32 numArgs, Delegate catchHandler)

     
    System.Exception
    Error HRESULT E_FAIL has been returned from a call to a COM component.
       at MS.Internal.XcpImports.CheckHResult(UInt32 hr)
       at MS.Internal.XcpImports.SetValue(IManagedPeerBase obj, DependencyProperty property, String s)
       at MS.Internal.XcpImports.SetValue(IManagedPeerBase doh, DependencyProperty property, Object obj)
       at System.Windows.DependencyObject.SetObjectValueToCore(DependencyProperty dp, Object value)
       at System.Windows.DependencyObject.SetEffectiveValue(DependencyProperty property, EffectiveValueEntry& newEntry, Object newValue)
       at System.Windows.DependencyObject.UpdateEffectiveValue(DependencyProperty property, EffectiveValueEntry oldEntry, EffectiveValueEntry& newEntry, ValueOperation operation)
       at System.Windows.DependencyObject.SetValueInternal(DependencyProperty dp, Object value, Boolean allowReadOnlySet)
       at System.Windows.DependencyObject.SetValueInternal(DependencyProperty dp, Object value)
       at System.Windows.DependencyObject.SetValue(DependencyProperty dp, Object value)
       at System.Windows.ResourceDictionary.set_Source(Uri value)
       at BetterPlace.OBS.GIS.MapControl.LoadFeatureLayers() in C:\Projects\Company.GIS.MapControl\MapControl.cs:line 688
       at Company.GIS.MapControl.OnApplyTemplate() in C:\Projects\Company.GIS.MapControl\MapControl.cs:line 163
       at System.Windows.FrameworkElement.OnApplyTemplate(IntPtr nativeTarget)


The other option is that I have problems with exceptions being thrown in VS , see Tess’s Blog Post.

Found this:

http://willg.co.uk/default.aspx

Could be useful


I had hoped the Visual Studio 2010 SP1 will solve this problem – no such luck.

Hopefully installing the whole system from scratch will solve the problem (I have 4GB of memory and windows 7 32Bit and already wanted to upgrade to 64bit). I am not posting this on Microsoft forums because if doesn’t happen on the new system I won’t be able to post debugger dumps and logs that they will surely need.


Keywords: VS2010, build, error

IceRocket Tags: ,,

Friday, February 11, 2011

Silverlight Memory Leak, Part 4

Check out part 1, part 2 and part 3 (TODO).

I think it was back in 2007 that I did a presentation using CLR Profiler. I actually learned a lot from that presentation because of how difficult to understand that little program was I had to dig into CLR via C# just to understand the basic concepts. At a job interview 6 months ago I was asked a lot about CLR memory issues and I was amazed how much I actually remembered. I am kinda sorry I lost that presentation…

I wanted to see how difficult using it will be in Silverlight, since I read in David Bronman’s blog that you can now “Can target Silverlight 4 web apps”.


In my first try I choose target CLR Version of “V4 Core CLR”:

CLRProfiler-silverlight-clr

When the application was up I clicked on “Show Heap now” (the bottom button on the left). But the more interesting window is View->Summery:

CLRProfiler-wrong-summery

The final Heap Bytes looked just wrong, because:

CLRProfiler-task-manager-first-trial

I thought the profiler was attached to the wrong process, but…


I tried using target CLR Version of “V4 Desktop CLR” and used Attach Process:

clrprofiler-wrong-target-clr

Text format:

No CLR Version v4. is loaded into the target process.

And I also tried to trick the profiler and set Firefox as my default browser. But it didn’t work Internet Explorer just popped up…

(choosing “V4 Desktop CLR” and Start URL just points you to “V4 Core CLR” for Silverlight profiling)


So I went back to my first thought and this time I actually looked into the graph of “Show Heap now”:

clrprofiler-found-mappoint

(If you can see there is a MapPoint there – ESRI Silverlight object that I use)

Then I thought it will be nice to check for ultra black light by running into a wall (I read it somewhere but can’t remember where (Scifi book?)) because I forgot: CLR Profiler => CLR => Managed memory != Task manager memory. So I opened VMMap to look at the managed memory and it was 17MB – where is a wall when you need one?!?

I am confused… Allocated bytes should have at least shown 17MB, no?

clrprofiler-before-closing-IE

Then I just decided to go home (it was around 10PM) so I closed the IE (every other time I used CLR Profiler “Kill Application” button) and this window popped up:

clrprofiler-after-closing-ie

Why me? Home looks so far away right now…

It seems like CLR Profiler found it’s lost memory but only when I terminated the application outside of the CLR Profiler scope. I posted a comment on this in “Building Development and Diagnostic Tools for .Net” forum but still have no answer…

The application show almost everything in flow charts and it hasn’t changed in the last 6 year (at least). Back when I did my presentation I said that though the other programs are more user friendly and cost accordingly, CLR Profiler has the potential to be just as good but the application is just not quite ready for a regular user.

It has the potential because it has all the relevant CLR memory data stored in relatively small files (profiling my map application took 65MB where Ants took more than 1GB) and the source code is included (I believe the EULA states you can do what ever you want with the code, but check it out (there is also a forum post on this EULA)).

The application gives almost all the functionality of Ants but the learning curve is much steeper (unlike many applications you can’t use this program as a novice to find real memory leaks – novices always show an example of running this program with a loop and one class being recreated and claim the program is easy…).


My purpose here is just to give you some general lines of how to start with the application. For more information you should read the Word document included in the installation of the application.

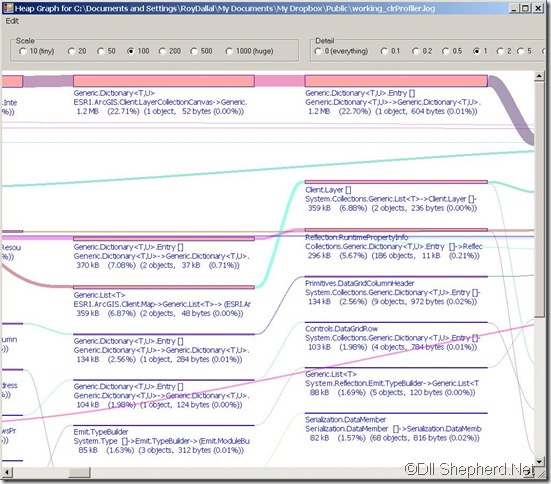
So where do I start? Not in the Heap Graph that is opened automatically:

CLR-profiler-heap-graph-unreadable

Can anyone really see what is happening here? and that is with Detail=1 in Detail=0(everything) the lines look like a cat played with them – and the cat won! With Scale=10 and Detail=0:

clr-profiler-totally-unreadable

In a demo app this would have looked like one line going from left (origin usually the main window) to the right (the actual object in memory).


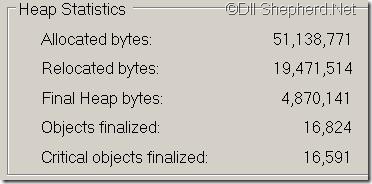
So where should you start from? I find the summery page to be quite organized with actual numbers (no graphs):

clr-profiler-heap-statistics

What to look at?

  • Allocated bytes is a waste of time, it will give you a look of what objects the application created but most of them were freed…
  • Relocated bytes is more interesting but still not quite there, it gives you a look into objects that the GC moved –> the long lived objects
  • Final Heap bytes is the gold mine, it gives you a look at the objects that were not freed. It is especially a good place if the profile was of a closing application – those are the items that are still there (without a driver on the wheel)…
  • Object finalized (critical or regular) in my application were only Silverlight Framework objects and most of them were critical

So looking at Final Heap bytes there are three buttons:

clr-profiler-Final-Heap-bytes-buttons

Objects by address is a waste of time – look in VMMap, it is much more readable there.

Histogram by Age is useful but for a clear picture you will have to play a lot with the scales.

Histogram give you a nice clear picture from the start:

clr-profiler-histogram

Right clicking on an element in the graph and choose “Show Who Allocated”:

clr-profiler-histogram-right-click

This will open up the Allocation Graph filtered by the object you selected:

clr-profiler-filtered-allocation-graph

(it is still a lot of data though so play a bit with the detail scale)

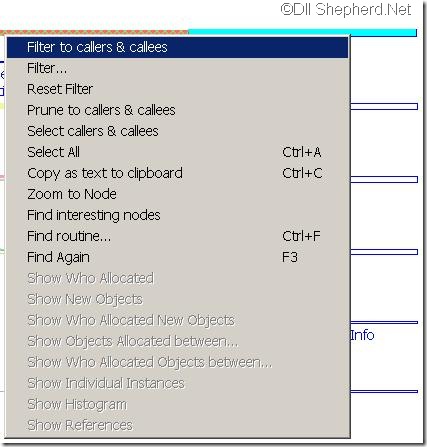
Sometimes the filtering doesn’t work so reach the end of the graph (right most) and select the object (in my case EventHandler) right click on it and  select “Filter to callers & callees” (is that a typo?):

clr-profiler-allocation-graph-right-click

And the graph will be less problematic:

clr-profiler-less-lines

Now it is more like the novices demos, a single line where you just have to search for the root cause of the memory. In this case the root cause of the memory is ESRI’s method to GetGeometry method:

ESRI.ArcGIS.Client.Tasks.Utils.JSON.ArcGISJsonReader::GetGeometry static ESRI.ArcGIS.Client.Geometry.Geometry (<UNKNOWN>  bool):     325 kB    (90.95%)

(the application supports copying the data to the clipboard)

This is not necessarily an example of a memory leak, I just choose this in random… (though it is curious the memory was still in the final heap when I closed the IE (but maybe it was just on the way to be cleared, from the Word guide on Final Heap bytes: “This may include some objects that are no longer referenced, but that have not yet been cleaned up by the garbage collector.”))


And some things will still seem off:

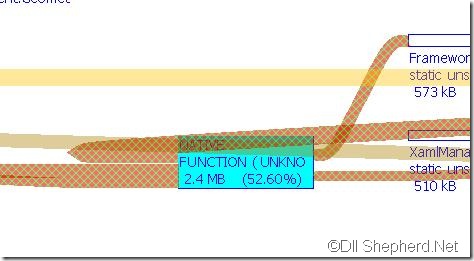
clr-profiler-unknown-double-click

(seems to be something of the Silverlight Framework (you can just see the Xaml on the right))


So to conclude, the CLR Profiler is a free profiler with open source (though the code is not very nice). I think the Profiler should be separated into a CLR Profiler and a CLR Profile Viewer. The Profiler should just create log files and the Viewer will read that log file and give a more simple, user friendly view of the data. That way the Viewer could still work with existing CLR Profiler logs. I also believe it should be a free community product (open source) with the support of Microsoft.


TODO: might be a good idea to move this post before part 3 (maybe use another program for part 3?)


Resources:

CLRProfiler V4 Released


Keywords: Silverlight, memory, CLRProfiler

Tuesday, February 8, 2011

Silverlight Memory Leak, Part 3

Check out part 1 and part 2.

Events

My second problem was apparently events.

The application is event driven and though the windows/entities were no longer used, there was still an event connecting them to the main Application.

Again I started Ants Profiler this time I used the application once, took a memory snapshot (to have a base line) and then used it again and took a snapshot.

ants-events-timeline

Now in our application we use some 3rd party controls and profiling those won’t help me. So there is a little option at the bottom of Class List called Filters, I use “Filter by Reference” -> “Kept in memory exclusively by:” and just add the Namespace for my company:

ants-memory-filter

Now all the counts are those that are relevant to me. The top 3 classes in Class List are:

ants-events-class-list

Number 2 in there is EventHandler, and it just grows.


I actually found a few root causes for this:

1. Singleton objects that keep the events even when they are no longer used.

2. Another thing is looking for objects in the Silverlight main page that could have been cleared but were not:

ants-event-root-cause

I actually looked for Instances in the Instance List that had the largest “Distance from GC Root”. Meaning that the memory wasn’t freed the longest (for example this one had a value of 17).

The end result was:

ants-event-end-result


Unmanaged memory

Right now, around 94% of the memory used by my Application is Unmanaged:

ants-unmanaged-memory

Ants is unhelpful, their help suggested filtering by BitmapImage but that returned zero changes between Snapshots:

ants-image-profile

The jumps in the timeline graph are mostly because of the Unmanaged memory (and Ants doesn’t seem to show the difference in the memory usage, I had to switch the current snapshot to find this little detail).

So I opened VMMap again and by mistake found a new feature, in the timeline window you can actually select the start end time (just drag your selection on the graph):

VMMap-timeline-start-end-time

And now the main window show the difference between the runs:

vmmap-main-difference-filter

The Heap made a jump of 7MB, the managed heap of 5MB. Waiting a bit and testing again and the managed heap was down 1MB (the Heap was +/- the same).

Like the video said I used HeapMonitor (unlike the video I ran it the same as I ran the profiler for Ants, setting a base line and then starting the program):

HeapMonitor.cmd -p 5284

(Where 5284 was the process Id for the IE process of the Silverlight application)

It takes some time and ~1.65 GB of Hard Disk and I got to running xperf:

xperf 5284-heap-trace.etl

(Where 5284-heap-trace.etl is the file created by HeapMonitor)

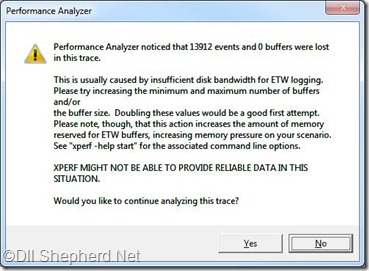
And got this window:

xperf-warning-etw

Text version:

Performance Analyzer noticed that 13912 events and 0 buffers were lost in this trace.

This is usually caused by insufficient disk bandwidth for ETW logging.
Please try increasing the minimum and maximum number of buffers and/or
the buffer size.  Doubling these values would be a good first attempt.
Please note, though, that this action increases the amount of memory
reserved for ETW buffers, increasing memory pressure on your scenario.
See "xperf -help start" for the associated command line options.

XPERF MIGHT NOT BE ABLE TO PROVIDE RELIABLE DATA IN THIS SITUATION.

Would you like to continue analyzing this trace?

(Is it just me or MessageBox best feature is the clipboard copy?)

I pressed Yes(since I am pretty sure this is just because my computer dying).

I actually tested this again in another Windows7 computer that I have and got the same warning. Does anyone know what it means? I posted about it in the performance Silverlight forum, hopefully someone will help me (or say it is nothing)…


Now set your symbols, Trace->Configure Symbol Paths:

xperf-right-symbol-settings

In the first row just enter (C:\SymCache is the default symbols folder and should be written in both lines):

SRV*C:\SymCache*http://msdl.microsoft.com/download/symbols

and then activate the symbols Trace->Load Symbols.


Like in the video I opened Summery Table for Heap Outstanding Allocation Size:

xperf-heap-outstanding-allocation-graph-selection

In the grid that is opened you should enable the Stack column (otherwise you won’t see the Dlls/methods).

xperf-heap-live-allocations

If you set the symbols right you will get this window (when the Stack column is on and a Symbol needs to be translated):

MICROSOFT-SOFTWARE-LICENSE-TERMS

It seems that most of my memory is either AOFO - Allocated Outside Freed Outside or AIFI - Allocated Inside Freed Inside (not a memory leak).

xperf-with-symbols


Troubleshooting:

You probably didn’t set the symbols right if you can’t see method names:

xperf-no-symbols

(I had used SRV*C:\MyProject\Bin\Debug*http://msdl.microsoft.com/download/symbols here)

TODO: Not finished… Hope I won’t need to format my computer tomorrow… (I already backed up all my stuff either way)


Resources:

Performance on Silverlight TV

Analyzing Silverlight Memory Usage: Part 1 – Obtaining Measurements


Keywords: Silverlight, memory leak, vmmap, xperf, HeapMonitor

Thursday, February 3, 2011

Silverlight error connecting to WCF

So after I fixed some of the memory problems with my application yesterday. I started my application and tried our address auto complete feature (it’s one of the most basic features that we have). I got this little error on the bottom left of the screen:

silverlight-default-exception-handler

Double clicking it I got my exception:

Message: Unhandled Error in Silverlight Application An AsyncCallback threw an exception.   at System.ServiceModel.AsyncResult.Complete(Boolean completedSynchronously)
   at System.ServiceModel.Channels.HttpChannelFactory.HttpRequestChannel.HttpChannelAsyncRequest.OnGetResponse(IAsyncResult result)
   at System.Net.Browser.BrowserHttpWebRequest.<>c__DisplayClassd.<InvokeGetResponseCallback>b__b(Object state2)
   at System.Threading.QueueUserWorkItemCallback.WaitCallback_Context(Object state)
   at System.Threading.ExecutionContext.Run(ExecutionContext executionContext, ContextCallback callback, Object state, Boolean ignoreSyncCtx)
   at System.Threading.QueueUserWorkItemCallback.System.Threading.IThreadPoolWorkItem.ExecuteWorkItem()
   at System.Threading.ThreadPoolWorkQueue.Dispatch()
   at System.Threading._ThreadPoolWaitCallback.PerformWaitCallback()
Line: 1
Char: 1
Code: 0
URI: http://localhost/version/MyApplication/js/update.js

First I thought that maybe I am trying to use another server, I fixed that but still got the error (so that wasn’t the problem).

So I started logging and got the following error reading the traces.svclog log file:

There is an unclosed literal string. Line ##, position ##.

So I decided to open the file with Notepad++ and used TextFX->TextFX HTML Tidy->Tidy: reindent XML

I couldn’t find and reference to my AutoComplete service but I found this error lurking around:

System.Runtime.InteropServices.COMException
                  (0x8004150D): Out of server memory [SDE.Default]
                  at
                  ESRI.ArcGIS.DataSourcesGDB.SdeWorkspaceFactoryClass.OpenFromString(String
                  connectStr, Int32 hWnd) at
                  Company.GIS.Core.Esri.WorkspaceProvider.CreateWorkspace(String
                  sdeConnectionString) in
                  C:\Projects\P652\Company\GIS\Framework\Server\Source\Company.GIS.Core\Company.GIS.Core.Esri\Workspace\WorkspaceProvider.cs:line
                  105 at …

Apparently my memory problems just got worst because ESRI decided to jump ship (shit).

Tried to change the web.config and do a bit IISreset, Start the debugger and got the error: HTTP Error 503. The service is unavailable.

Restart doesn’t help…

But the simplest solution did work – I just moved my applications to another App Pool…

And found out the hard way that my team leader didn’t check in his changes and because of that I got the original Error!

//TODO: I still need to study the COMException Out of server memory

Keywords: IIS, Error, Silverlight, WCF

IceRocket Tags: ,,,