Check out part 1, part 2 and part 3 (TODO).
I think it was back in 2007 that I did a presentation using CLR Profiler. I actually learned a lot from that presentation because of how difficult to understand that little program was I had to dig into CLR via C# just to understand the basic concepts. At a job interview 6 months ago I was asked a lot about CLR memory issues and I was amazed how much I actually remembered. I am kinda sorry I lost that presentation…
I wanted to see how difficult using it will be in Silverlight, since I read in David Bronman’s blog that you can now “Can target Silverlight 4 web apps”.
In my first try I choose target CLR Version of “V4 Core CLR”:
When the application was up I clicked on “Show Heap now” (the bottom button on the left). But the more interesting window is View->Summery:
The final Heap Bytes looked just wrong, because:
I thought the profiler was attached to the wrong process, but…
I tried using target CLR Version of “V4 Desktop CLR” and used Attach Process:
Text format:
No CLR Version v4. is loaded into the target process.
And I also tried to trick the profiler and set Firefox as my default browser. But it didn’t work Internet Explorer just popped up…
(choosing “V4 Desktop CLR” and Start URL just points you to “V4 Core CLR” for Silverlight profiling)
So I went back to my first thought and this time I actually looked into the graph of “Show Heap now”:
(If you can see there is a MapPoint there – ESRI Silverlight object that I use)
Then I thought it will be nice to check for ultra black light by running into a wall (I read it somewhere but can’t remember where (Scifi book?)) because I forgot: CLR Profiler => CLR => Managed memory != Task manager memory. So I opened VMMap to look at the managed memory and it was 17MB – where is a wall when you need one?!?
I am confused… Allocated bytes should have at least shown 17MB, no?
Then I just decided to go home (it was around 10PM) so I closed the IE (every other time I used CLR Profiler “Kill Application” button) and this window popped up:
Why me? Home looks so far away right now…
It seems like CLR Profiler found it’s lost memory but only when I terminated the application outside of the CLR Profiler scope. I posted a comment on this in “Building Development and Diagnostic Tools for .Net” forum but still have no answer…
The application show almost everything in flow charts and it hasn’t changed in the last 6 year (at least). Back when I did my presentation I said that though the other programs are more user friendly and cost accordingly, CLR Profiler has the potential to be just as good but the application is just not quite ready for a regular user.
It has the potential because it has all the relevant CLR memory data stored in relatively small files (profiling my map application took 65MB where Ants took more than 1GB) and the source code is included (I believe the EULA states you can do what ever you want with the code, but check it out (there is also a forum post on this EULA)).
The application gives almost all the functionality of Ants but the learning curve is much steeper (unlike many applications you can’t use this program as a novice to find real memory leaks – novices always show an example of running this program with a loop and one class being recreated and claim the program is easy…).
My purpose here is just to give you some general lines of how to start with the application. For more information you should read the Word document included in the installation of the application.
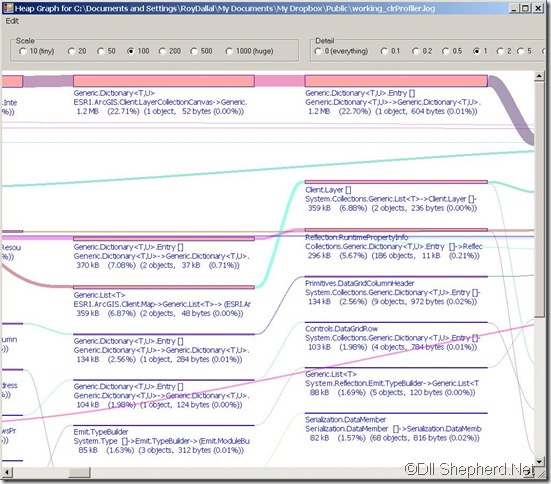
So where do I start? Not in the Heap Graph that is opened automatically:
Can anyone really see what is happening here? and that is with Detail=1 in Detail=0(everything) the lines look like a cat played with them – and the cat won! With Scale=10 and Detail=0:
In a demo app this would have looked like one line going from left (origin usually the main window) to the right (the actual object in memory).
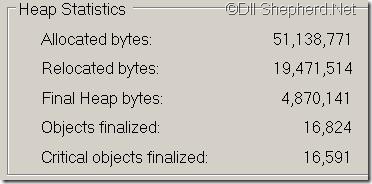
So where should you start from? I find the summery page to be quite organized with actual numbers (no graphs):
What to look at?
- Allocated bytes is a waste of time, it will give you a look of what objects the application created but most of them were freed…
- Relocated bytes is more interesting but still not quite there, it gives you a look into objects that the GC moved –> the long lived objects
- Final Heap bytes is the gold mine, it gives you a look at the objects that were not freed. It is especially a good place if the profile was of a closing application – those are the items that are still there (without a driver on the wheel)…
- Object finalized (critical or regular) in my application were only Silverlight Framework objects and most of them were critical
So looking at Final Heap bytes there are three buttons:
Objects by address is a waste of time – look in VMMap, it is much more readable there.
Histogram by Age is useful but for a clear picture you will have to play a lot with the scales.
Histogram give you a nice clear picture from the start:
Right clicking on an element in the graph and choose “Show Who Allocated”:
This will open up the Allocation Graph filtered by the object you selected:
(it is still a lot of data though so play a bit with the detail scale)
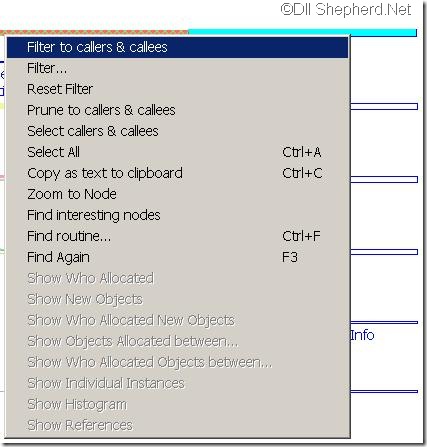
Sometimes the filtering doesn’t work so reach the end of the graph (right most) and select the object (in my case EventHandler) right click on it and select “Filter to callers & callees” (is that a typo?):
And the graph will be less problematic:
Now it is more like the novices demos, a single line where you just have to search for the root cause of the memory. In this case the root cause of the memory is ESRI’s method to GetGeometry method:
ESRI.ArcGIS.Client.Tasks.Utils.JSON.ArcGISJsonReader::GetGeometry static ESRI.ArcGIS.Client.Geometry.Geometry (<UNKNOWN> bool): 325 kB (90.95%)
(the application supports copying the data to the clipboard)
This is not necessarily an example of a memory leak, I just choose this in random… (though it is curious the memory was still in the final heap when I closed the IE (but maybe it was just on the way to be cleared, from the Word guide on Final Heap bytes: “This may include some objects that are no longer referenced, but that have not yet been cleaned up by the garbage collector.”))
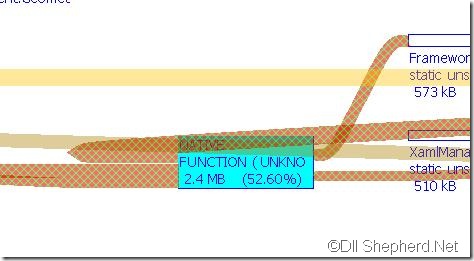
And some things will still seem off:
(seems to be something of the Silverlight Framework (you can just see the Xaml on the right))
So to conclude, the CLR Profiler is a free profiler with open source (though the code is not very nice). I think the Profiler should be separated into a CLR Profiler and a CLR Profile Viewer. The Profiler should just create log files and the Viewer will read that log file and give a more simple, user friendly view of the data. That way the Viewer could still work with existing CLR Profiler logs. I also believe it should be a free community product (open source) with the support of Microsoft.
TODO: might be a good idea to move this post before part 3 (maybe use another program for part 3?)
Resources:
Keywords: Silverlight, memory, CLRProfiler


