Events
My second problem was apparently events.
The application is event driven and though the windows/entities were no longer used, there was still an event connecting them to the main Application.
Again I started Ants Profiler this time I used the application once, took a memory snapshot (to have a base line) and then used it again and took a snapshot.
Now in our application we use some 3rd party controls and profiling those won’t help me. So there is a little option at the bottom of Class List called Filters, I use “Filter by Reference” -> “Kept in memory exclusively by:” and just add the Namespace for my company:
Now all the counts are those that are relevant to me. The top 3 classes in Class List are:
Number 2 in there is EventHandler, and it just grows.
I actually found a few root causes for this:
1. Singleton objects that keep the events even when they are no longer used.
2. Another thing is looking for objects in the Silverlight main page that could have been cleared but were not:
I actually looked for Instances in the Instance List that had the largest “Distance from GC Root”. Meaning that the memory wasn’t freed the longest (for example this one had a value of 17).
The end result was:
Unmanaged memory
Right now, around 94% of the memory used by my Application is Unmanaged:
Ants is unhelpful, their help suggested filtering by BitmapImage but that returned zero changes between Snapshots:
The jumps in the timeline graph are mostly because of the Unmanaged memory (and Ants doesn’t seem to show the difference in the memory usage, I had to switch the current snapshot to find this little detail).
So I opened VMMap again and by mistake found a new feature, in the timeline window you can actually select the start end time (just drag your selection on the graph):
And now the main window show the difference between the runs:
The Heap made a jump of 7MB, the managed heap of 5MB. Waiting a bit and testing again and the managed heap was down 1MB (the Heap was +/- the same).
Like the video said I used HeapMonitor (unlike the video I ran it the same as I ran the profiler for Ants, setting a base line and then starting the program):
HeapMonitor.cmd -p 5284
(Where 5284 was the process Id for the IE process of the Silverlight application)
It takes some time and ~1.65 GB of Hard Disk and I got to running xperf:
xperf 5284-heap-trace.etl
(Where 5284-heap-trace.etl is the file created by HeapMonitor)
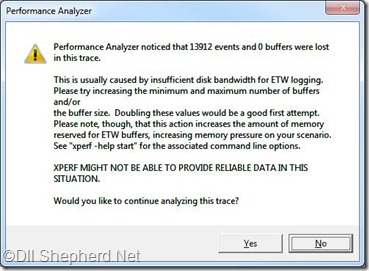
And got this window:
Text version:
Performance Analyzer noticed that 13912 events and 0 buffers were lost in this trace.
This is usually caused by insufficient disk bandwidth for ETW logging.
Please try increasing the minimum and maximum number of buffers and/or
the buffer size. Doubling these values would be a good first attempt.
Please note, though, that this action increases the amount of memory
reserved for ETW buffers, increasing memory pressure on your scenario.
See "xperf -help start" for the associated command line options.XPERF MIGHT NOT BE ABLE TO PROVIDE RELIABLE DATA IN THIS SITUATION.
Would you like to continue analyzing this trace?
(Is it just me or MessageBox best feature is the clipboard copy?)
I pressed Yes(since I am pretty sure this is just because my computer dying).
I actually tested this again in another Windows7 computer that I have and got the same warning. Does anyone know what it means? I posted about it in the performance Silverlight forum, hopefully someone will help me (or say it is nothing)…
Now set your symbols, Trace->Configure Symbol Paths:
In the first row just enter (C:\SymCache is the default symbols folder and should be written in both lines):
SRV*C:\SymCache*http://msdl.microsoft.com/download/symbols
and then activate the symbols Trace->Load Symbols.
Like in the video I opened Summery Table for Heap Outstanding Allocation Size:
In the grid that is opened you should enable the Stack column (otherwise you won’t see the Dlls/methods).
If you set the symbols right you will get this window (when the Stack column is on and a Symbol needs to be translated):
It seems that most of my memory is either AOFO - Allocated Outside Freed Outside or AIFI - Allocated Inside Freed Inside (not a memory leak).
Troubleshooting:
You probably didn’t set the symbols right if you can’t see method names:
(I had used SRV*C:\MyProject\Bin\Debug*http://msdl.microsoft.com/download/symbols here)
TODO: Not finished… Hope I won’t need to format my computer tomorrow… (I already backed up all my stuff either way)
Resources:
Analyzing Silverlight Memory Usage: Part 1 – Obtaining Measurements
Keywords: Silverlight, memory leak, vmmap, xperf, HeapMonitor


